

CPAS
Coaching Performance Assessment System evaluates coaches with a mixed-methods approach across behavioral intelligence, strategic track record, and contextualized performance production. Produces a quantifiable coaching score.

Coaching grade is developed, from the inputs underneath to the number on the screen.

Coaching AI grades every head coach, coordinator, and position coach in every game using our proprietary Black Box methodology, an algorithmic formula that transforms AI-collected data, a trade-secret system is modeled after the career of NFL legendary Green Bay Packers head coach Vince Lombardi, who coached multiple positions at the high school and professional levels while developing elite players and winning championships along the way.
Unlike conventional football analysis that relies on narrative opinion or surface-level statistics, Coaching AI grades are built entirely from Sports Intelligence inputs. Every grade reflects what a coach actually did on the field, not what analysts assumed, not what the media reported, and not what conventional wisdom suggests.

The Black Box evaluates coaches on dimensions that cannot be captured by traditional stats:
Each input is weighted by its real-world impact on game outcomes, not by media coverage or popular perception. The methodology has been validated against decade-long coaching performance data across the NFL.
Coaching Performance Assessment System evaluates coaches with a mixed-methods approach across behavioral intelligence, strategic track record, and contextualized performance production. Produces a quantifiable coaching score.
Sociological Qualitative Assessment Instrument analyzes speech for leadership qualities, ability to teach, strategize, and vocal tone.
Mix Method Composite Score combines the outputs of CPAS and SQAI into a single composite metric grading coaches across behavioral, strategic, and performance dimensions. The only data-backed coaching evaluation in sports.

The Overall Group Grade combines all 12 senior-level coaching roles: Head Coach, Offensive Coordinator, Defensive Coordinator, Special Teams Coordinator, QB, RB, WR, OL, TE, DL, LB, and DB. Each coach and staff group receives a score on the following scale:
Coaching AI evaluates the complete staff across 12 senior-level roles: Head Coach, Offensive Coordinator, Defensive Coordinator, Special Teams Coordinator, QB, RB, WR, OL, TE, DL, LB, and DB.
Head-to-Head Matchup
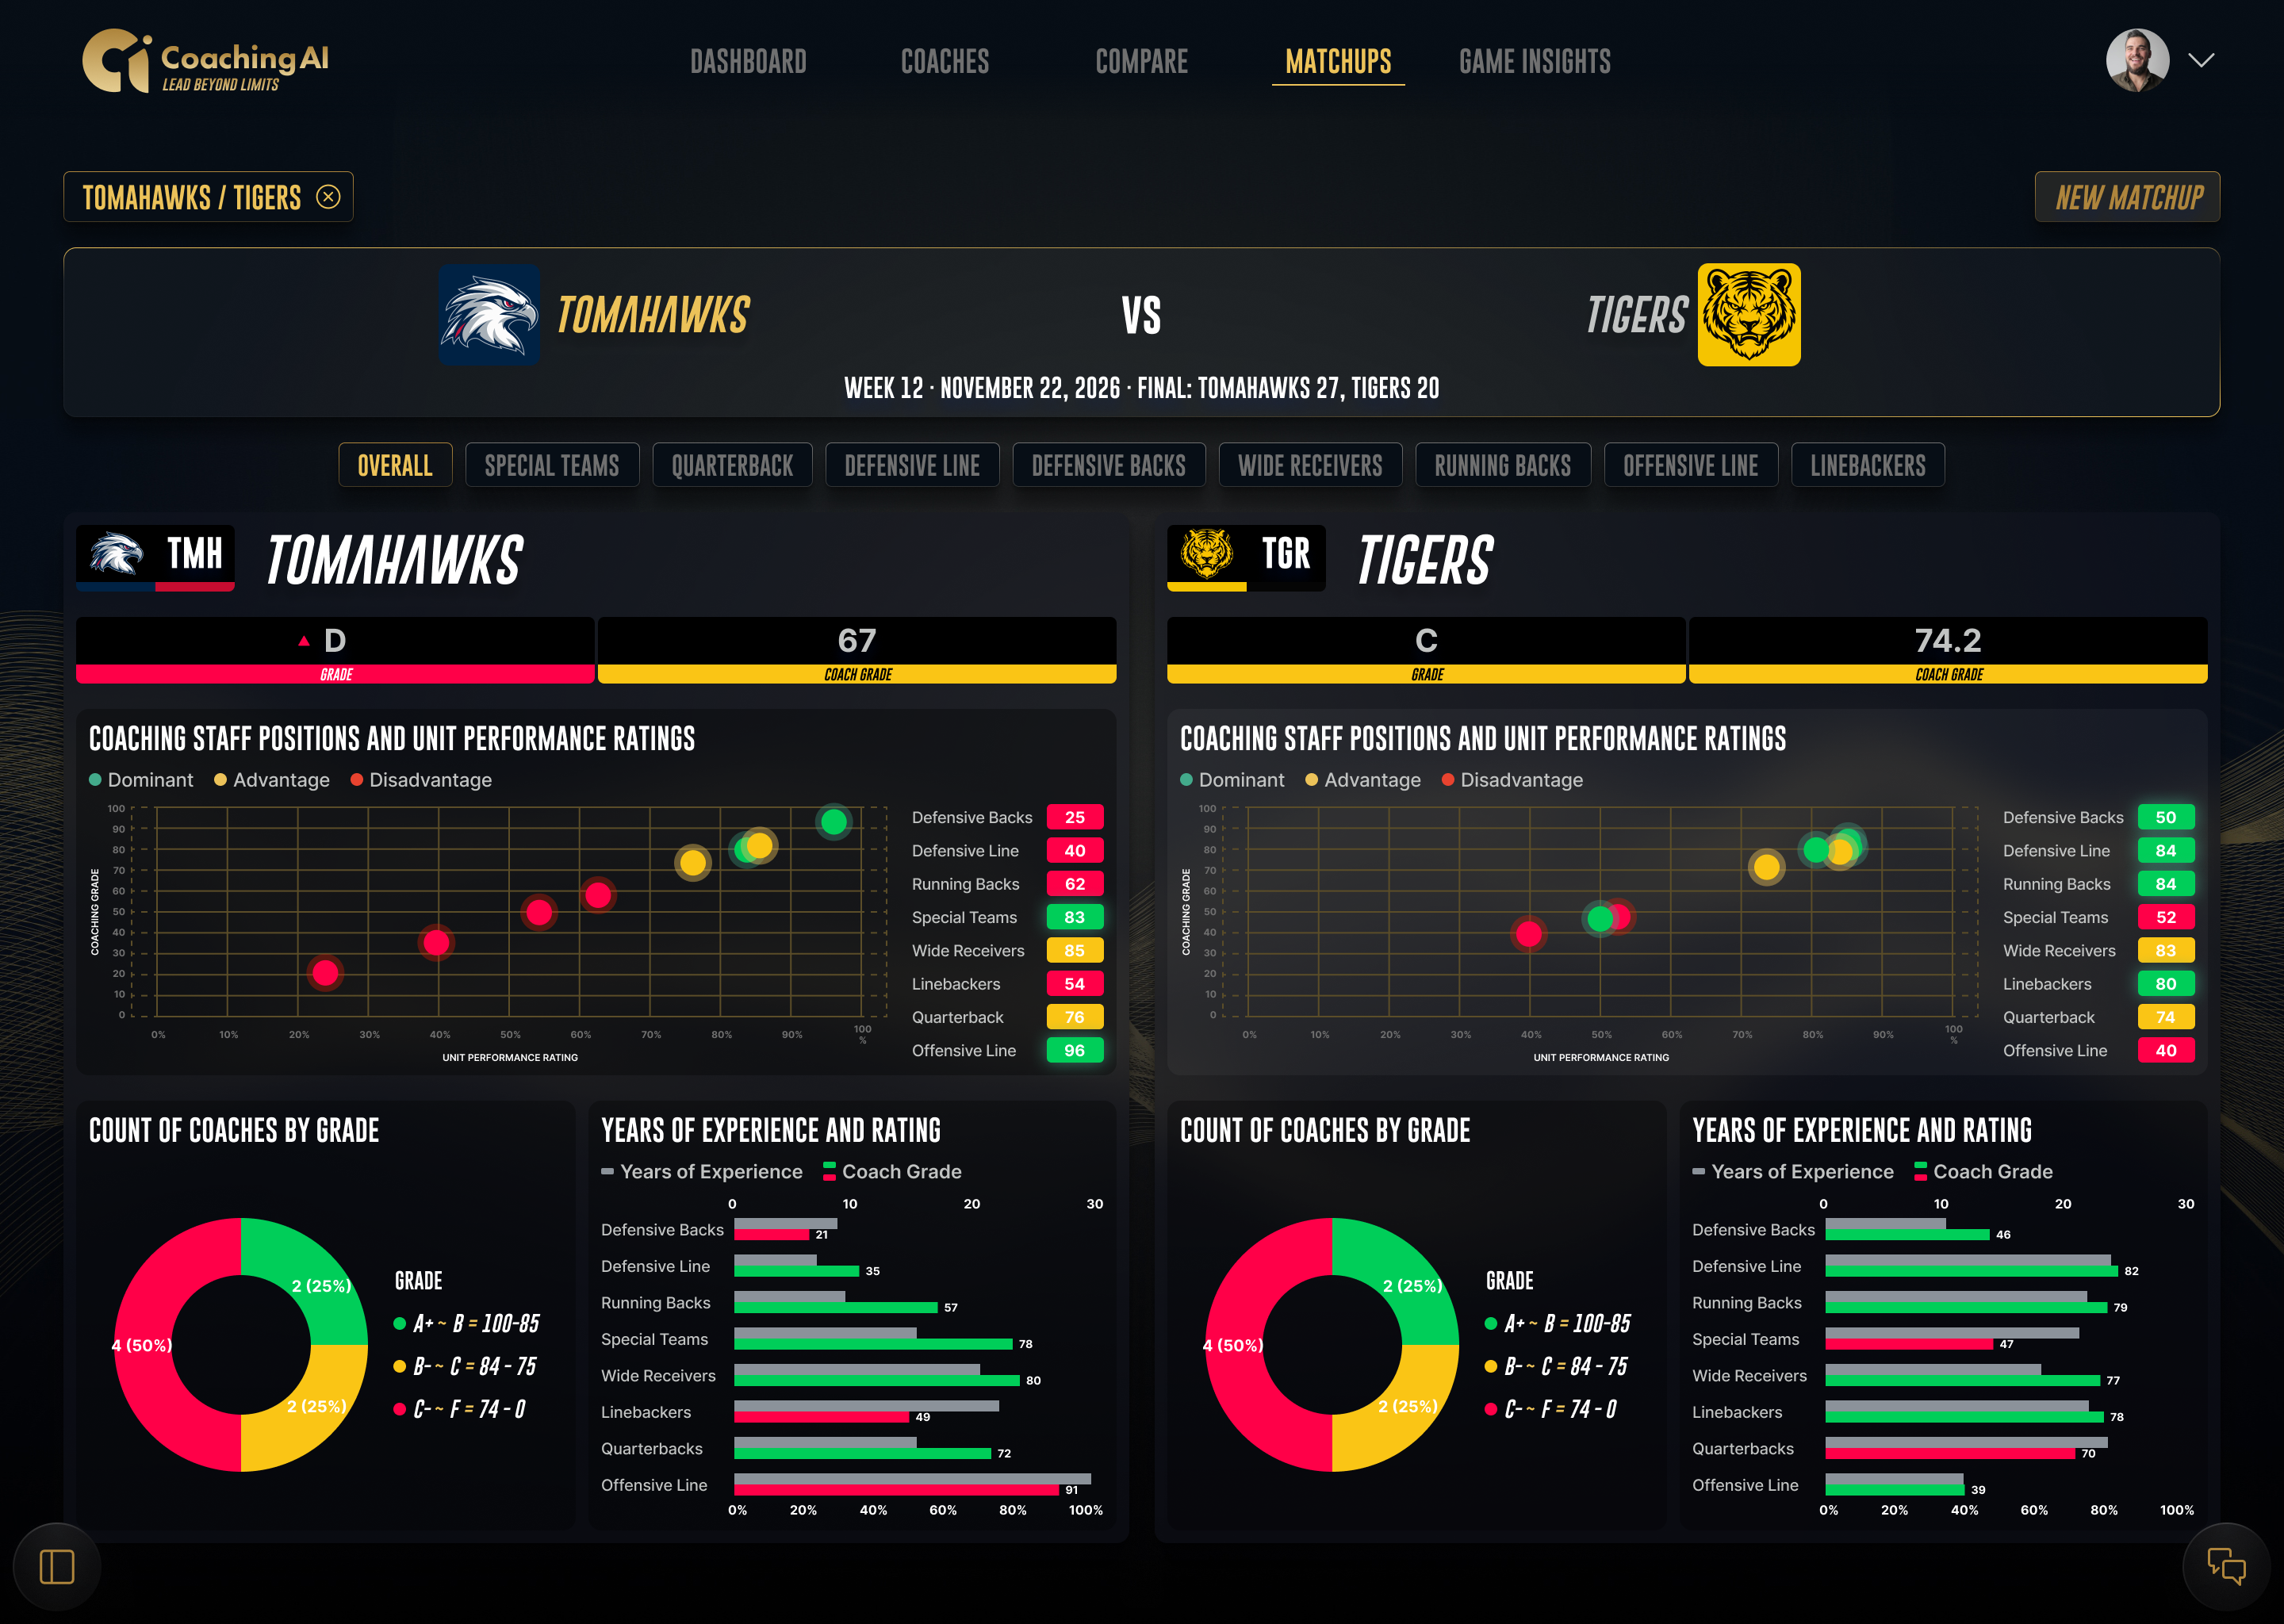
The Team Head-to-Head Matchup compares nine coaching units side-by-side: eight position coaches plus the Special Teams Coordinator. Each comparison pairs a coach with a selected, position-specific statistic that objectively measures effectiveness for that unit. The Head Coach and offensive and defensive coordinators remain in the Overall Group Grade, not the unit comparison rows.
Swipe to inspect the product screen
Quarterback Coach
Passer Rating
Running Back Coach
Yards After Contact Per Carry
Wide Receiver Coach
Contested Catch Rate
Offensive Line Coach
Pass Block Win Rate
Tight End Coach
Yards After Catch Per Target
Defensive Line Coach
Pass Rush Win Rate
Linebacker Coach
Tackle Efficiency Rate
Defensive Back Coach
Passer Rating Allowed
Special Teams Coordinator
Net Punt Avg. / FG %
At the conclusion of each matchup, a positional advantage tally is displayed, showing the total number of positional advantages held by each team across all nine Head-to-Head coaching units.
The High-Leverage Index answers a different question than the career score. The career score measures the record: wins, losses, and the full ledger. The HLI measures how a coach performs when the game is actually on the line, in the fourth quarter of one-score games, red zone situations, third and fourth downs, two-minute drills, and sudden-change possessions.
A play is classified as high-leverage when it carries a win probability shift of 8% or more. Six situation types qualify:
8%
Win probability shift or more
120
High-leverage snaps per season minimum
Unit efficiency in high-leverage situations vs. its own all-game baseline
Pre-snap penalties, burned timeouts, and decision quality in the final 5 minutes of one-score games
Second-half vs. first-half performance against the same opponent
Unit performance in postseason, rivalry, and playoff-implication games vs. regular slate, across multiple seasons
Two-source qualitative evidence: delegation of decisions, retention across staff changes, player testimony about preparation
| Component | What it measures | Position | Coordinator | Head coach |
|---|---|---|---|---|
| Leverage delta | Unit efficiency in high-leverage situations vs. its own all-game baseline | 35 | 30 | 25 |
| Crunch-time discipline | Pre-snap penalties, burned timeouts, and decision quality in the final 5 minutes of one-score games | 25 | 15 | 30 |
| Adjustment signal | Second-half vs. first-half performance against the same opponent | 15 | 25 | 15 |
| Big-stage persistence | Unit performance in postseason, rivalry, and playoff-implication games vs. regular slate, across multiple seasons | 15 | 20 | 20 |
| Corroboration | Two-source qualitative evidence: delegation of decisions, retention across staff changes, player testimony about preparation | 10 | 10 | 10 |
A signal must repeat across at least two seasons or two coaching stops before it is classified. One clutch season is noise; clutch at two different programs with different rosters is coaching. A minimum of 120 high-leverage snaps per season is required before any component is scored.
Big-moment performance is manufactured earlier in the week. Intimidation is unfamiliarity, and the HLI is built to find the coaches who cannot be surprised.

Halftime adjustment measures what a coordinator does with the information the first half provides. The opponent has shown its tendencies, coverages, and personnel groupings, and the halftime adjustment score captures whether the staff responded or stood still.
Halftime adjustment is not a standalone ranking. It is a contributing factor to each coordinator's and head coach's weekly grade, published every week throughout the NFL season.

Timeouts per half
Timeout currency measures how intelligently a coaching staff uses its three timeouts per half. A timeout saved for the right moment is worth more than a timeout burned on a coverage confusion in the second quarter, and the platform tracks every one.
Like halftime adjustment, timeout currency is a contributing factor to the weekly grade rather than a standalone ranking.

Produces a documented performance score. Bias-resistant by design.
